
I have just enrolled in a Data Science course on Udemy and I learned good stuff.
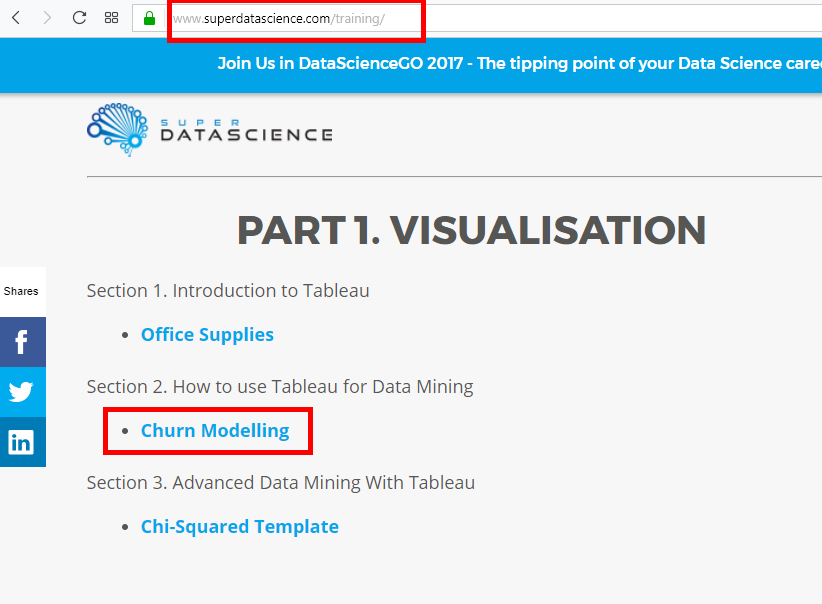
To have the dataset to do Data Mining, you need to go to the superdatascience website . In « Part.1 Visualization », you see the section « How to use Tableau for Data Mining ». Click on « Churn Modeling » to download the file.
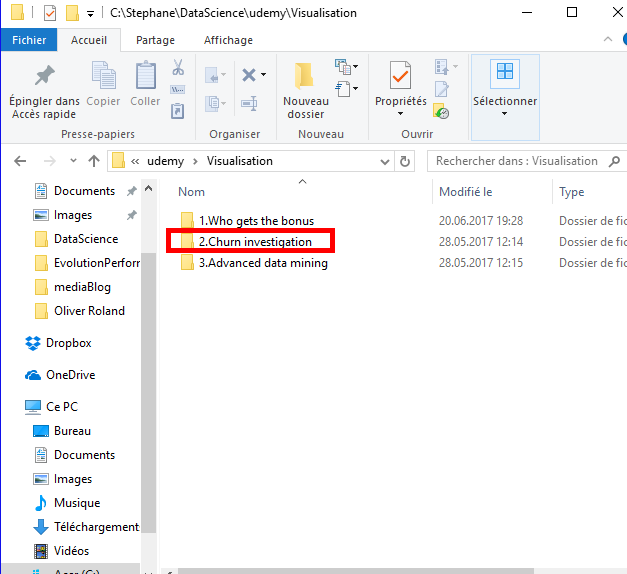
Once you have downloaded the file, move the file to the directory you created for the course. In this directory, create a new directory (unless you already do it) named « 2.Chunk investigation ».
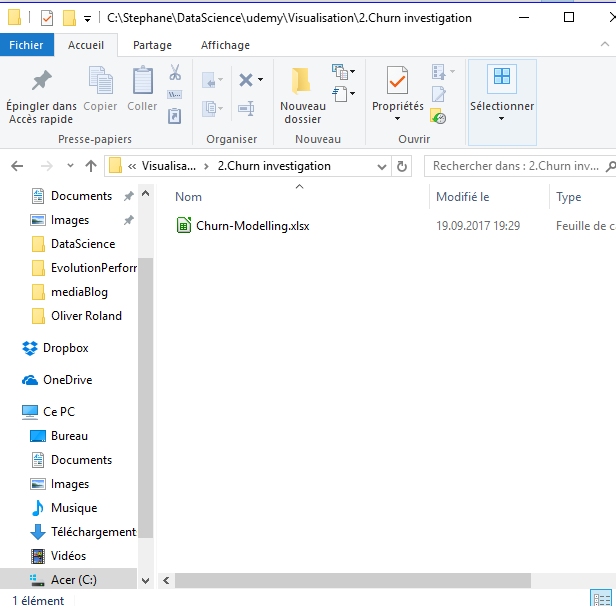
Open this fiel with Excel or with other spreadsheet software.
Know that we use this dataset for the visualization part but we will also use this dataset for the modeling part.
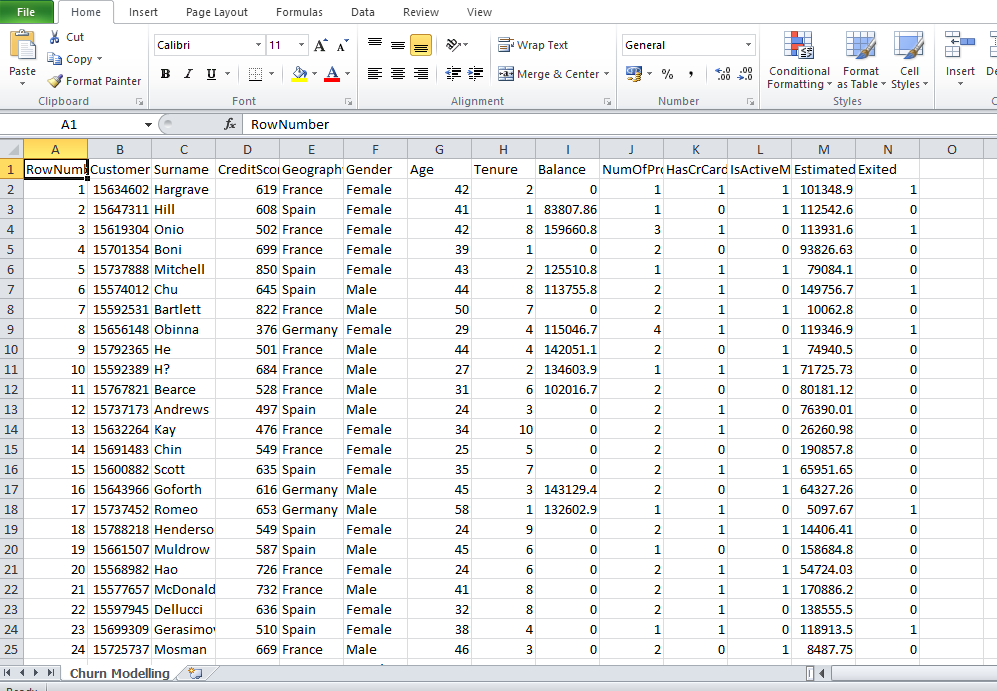
Let’s analyze the data of this dataset.
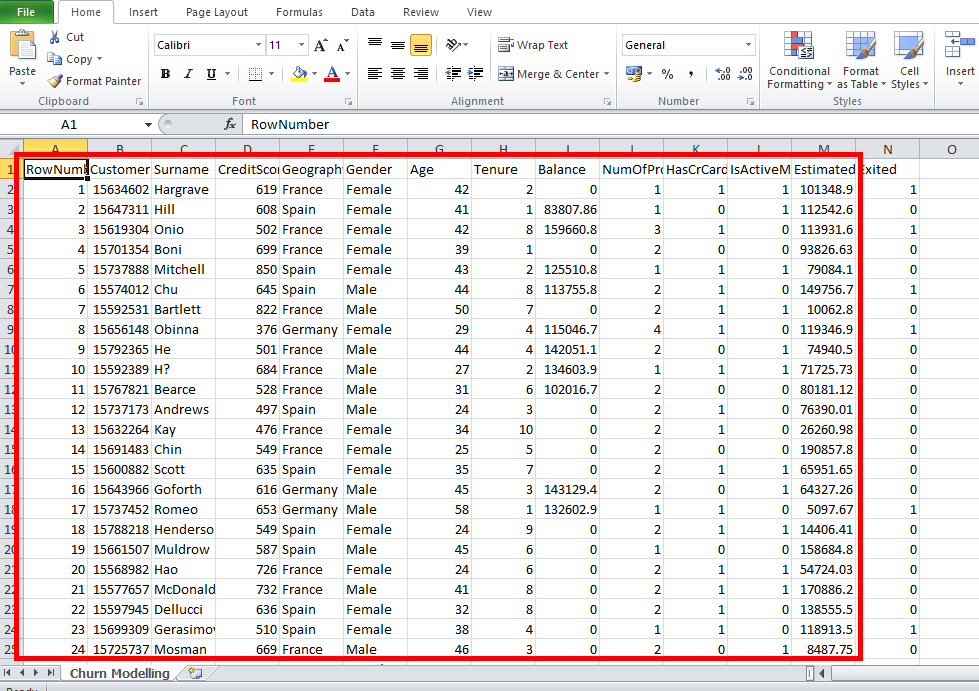
This dataset is quite large because it contains 10 000 lines and a few columns. This is the list of a bank’s client. The client information is :
-
Customer id (login)
-
Surname (last name)
-
Credit score ( is the measure that indicates the client’s ability to borrow)
-
Geography (client’s country)
-
Gender (male or female)
-
Age
-
Tenure -(the number of years the client is in the bank)
-
Balance (balance of the client’s bank account)
-
NumOfProduct (number of product that the client has in the bank – credit card, contract, account)
-
HasCrCard (does the client have a credit card ?)
-
IsActiveMember (did the client use his/her credit card during the last month ?)
-
EstimatedSalary (the bank’s estimate of the client’s annual salary)
-
Exited (did the client leave the bank ?)
Now, I will explain the context related to this dataset. This bank has branches in several countries like Germany, Spain and France. This bank noticed that lately there were many clients who left the bank. The bank has a report called « churn rate » which is the customers rate who leave the bank and for a few months the « churn rate » is really higher than usual. It’s for this reason that the bank needs a data scientist (you) to find the problem and propose solutions.
This dataset is a small sample of clients bank. These are 10 000 randomly selected client.
The column « Exited » is a column that didn’t exist before. This column has created when the bank realized that there was an abnormal number of client who were leaving the bank.
Then the bank observed these clients for 6 months to see which client left the bank.
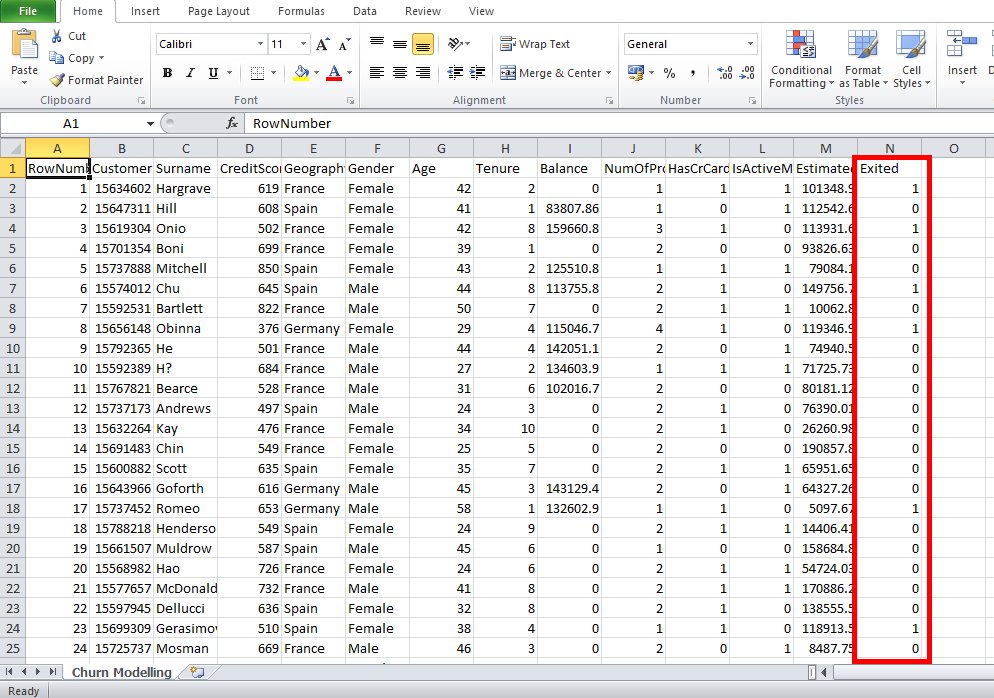
In the « Exited » column, the number « 1 » means that the client left the bank and the number « 0 » means that the client stayed in the bank.
To analyze this dataset, you’ll need to do A/B Tests. For exemple, a classic A/B Test is to see if women are more likely to left the bank than men. That’s means, see the number of men who left the bank, see the number of women who left the bank and then normalize by the total number of clients. It’s important to normalize the number of clients because there are not the same proportions of women as men. Next, based on the last column « Exited », you’ll find out if it’s the men or women who are likely to left the bank.
Once you have relevant results, you can show your report to the bank. And with this report you should be able to propose solutions to the bank. For example, if the report says that women leave the bank in bulk, it’s because there is a problem and it’s necessary to see whether the bank is offering women something right. Or it’s possible that another bank offers a much more attractive offer for women or something else.
You will learn how to investigate in the dataset and find answer through client information with A/B tests.
Share this article if you think it can help someone you know. Thank you.
-Steph